
Sep
Brands
32 PFAS in Baby Food by LC-MS/MS: Dr. Ehrenstorfer Reference Standards in a Shimadzu Application
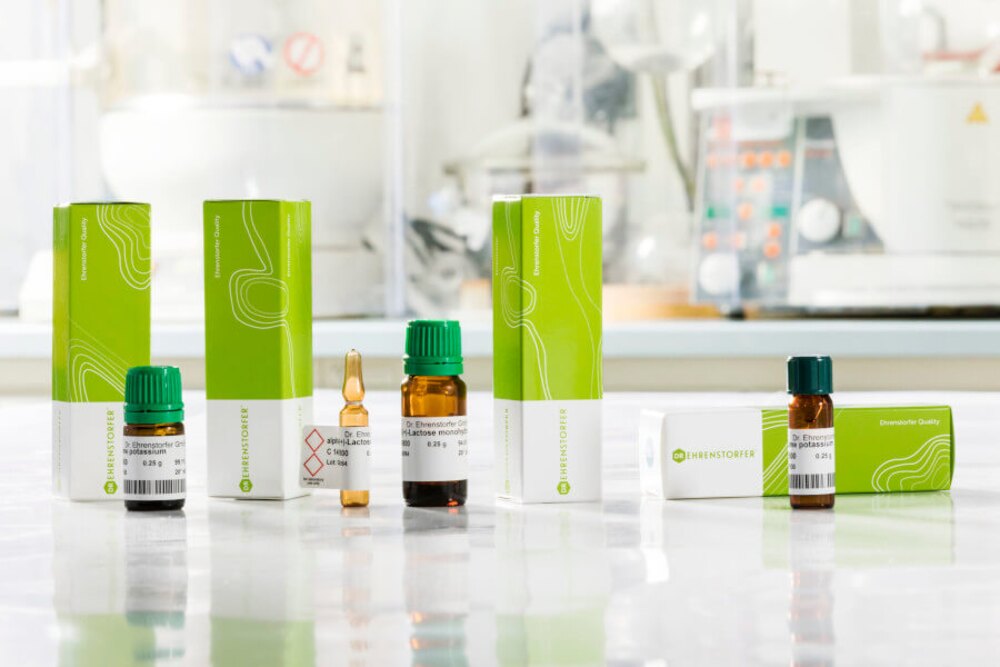
Shimadzu developed an LC-MS/MS method for the simultaneous quantitation of 32 PFAS in infant formula, using Dr. Ehrenstorfer reference standards during method development and evaluation.
- Matrix
- Infant formula
- Analytes
- 32 PFAS
- Instrument
- LCMS-8060NX · Nexera X3
- Acquisition
- MRM · negative ion
- Sample prep
- QuEChERS · dSPE
- Criteria
- AOAC SMPR 2023.003
- Reference standard
- Dr. Ehrenstorfer · ISO 17034
Why is PFAS analysis in food matrices difficult?
In this study, several PFAS were quantified at an LOQ as low as 0.01 µg/kg — while the analytical system itself is one of the contamination sources Shimadzu points out.
Shimadzu states that one of the main challenges is reducing background contamination from PFAS residues inside the LC system itself, as well as during sampling and sample preparation. PFAS are present in many common laboratory materials, so cross-contamination comes not from the sample but from the labware and the flow path.
The second challenge is the matrix. Shimadzu addressed it by building matrix-matched calibration curves and back-calculating spiked-sample concentrations against those curves, rather than using clean solvent.
The third is the concentration level. The lowest limit of quantitation in the study is 0.01 µg/kg, applied to 27 of the 32 analytes. Four analytes use 0.05 µg/kg and PFBA uses 0.25 µg/kg.
Shimadzu reports that the method meets the AOAC SMPR 2023.003 criteria without the use of internal standards. In practice, a laboratory adopting the method should assess matrix effects and the calibration strategy under its own conditions.
How did Shimadzu build the method?
This section summarises Application News 06-SAIP-LC-077-EN, published openly by Shimadzu on shimadzu.com, first edition October 2024.
The whole workflow follows a short path:
Infant formula → QuEChERS extraction → dSPE clean-up → LC-MS/MS (MRM)
- Weighing. 5.0 g of infant formula.
- Hydration and extraction. Add 15 mL water, vortex 2 minutes; add 5.0 mL acetonitrile, shake and vortex 2 minutes.
- QuEChERS partitioning. Add 4.0 g MgSO₄ and 1.0 g sodium acetate, vortex 2 minutes, centrifuge 10 minutes at 7,800 rpm.
- dSPE clean-up. Collect the supernatant, add dSPE sorbent, vortex 1 minute, centrifuge 5 minutes at 7,800 rpm.
- Concentration and reconstitution. Take 2.0 mL of the supernatant, dry under nitrogen, reconstitute to 1.0 mL with MeOH:H₂O 80:20 (v/v).
- Analysis. LC-MS/MS in MRM mode on an LCMS-8060NX coupled to a Nexera X3.
Calibration was external with 1/C² weighted regression over 0.005–10 µg/L; three compounds used 0.05–10 µg/L and PFBA used 0.25–10 µg/L. Spiked samples were prepared in six replicates at three levels: 0.01 · 0.05 · 0.25 µg/kg.
Instrument configuration
| Item | Specification |
|---|---|
| Mass spectrometer | Shimadzu LCMS-8060NX, triple quadrupole |
| Liquid chromatograph | Shimadzu Nexera™ X3 UHPLC |
| Ionisation mode | Negative ion mode — every transition in the document is marked (−) |
| Acquisition mode | MRM, two transitions per analyte (quantifier and qualifier) |
| Retention time window | 3.107 – 15.711 min |
| Separation time | All peaks eluted within 20 minutes |
The Application News is a four-page summary, so it does not state the analytical column, mobile phases, gradient, flow rate, column temperature or injection volume. A laboratory wishing to reproduce the method should contact Shimadzu for the full conditions. QEMIX does not infer these parameters.
The method, the experimental work and all data in this article belong to Shimadzu Analytical (India) Pvt. Ltd. QEMIX did not participate in developing, performing or validating this method; we cite the published document and add our own commentary on reference standards in section 06.
32 PFAS quantified simultaneously
The list spans five structural classes:
| Class | Analytes | Count |
|---|---|---|
| Carboxylic acids | PFBA · PFPeA · PFHxA · PFHpA · PFOA · PFNA · PFDA · PFUnA · PFDoA · PFTriDA · PFTeDA | 11 |
| Sulfonic acids | PFBS · PFPeS · PFHxS · PFHpS · PFOS · PFNS · PFDS · PFUnDS · PFDoS · PFTrDS | 10 |
| Fluorotelomer sulfonates | 4:2 FTS · 6:2 FTS · 8:2 FTS · 10:2 FTS | 4 |
| Ether acids | HFPO-DA · DONA · 9Cl-PF3ONS · 11Cl-PF3OUdS | 4 |
| Sulfonamides | PFOSA · N-Me-FOSAA · N-Et-FOSAA | 3 |
Retention times range from 3.1 to 15.7 minutes; Shimadzu separated every peak within twenty minutes.
The reference standard that was used
In the Material and Method section, Shimadzu writes:
“The reference standards were procured from Dr. Ehrenstorfer with below catalogue numbers: EPA Method 533 PFAS Mixture 151 100 µg/mL (DRE-A50000151MW).”
| Item | Value |
|---|---|
| Product No. | DRE-A50000151MW |
| Product name | EPA Method 533 PFAS Mixture 151, 100 µg/mL in Methanol:Water |
| Form | Multi-component solution |
| Certified components | 24 |
| Certification | Certified Reference Material (CRM). According to the certificate, the material was designed, produced and verified in accordance with ISO/IEC 17025, ISO 17034 and an ISO 9001 quality management system; the producer is A2LA accredited to ISO 17034:2016 (Cert. No. 3031.02). |
| Storage | 4 °C ± 4 °C |
Each lot is supplied with a Reference Material Certificate stating the certified concentration and expanded uncertainty of every component, individual lot numbers per component, purity, reference retention times and expiry date. Certified values are established gravimetrically and volumetrically, with confirmation by analytical technique.
The document records that Shimadzu purchased standards from Dr. Ehrenstorfer. It is not a declaration of partnership between the two companies, nor an endorsement by Dr. Ehrenstorfer of Shimadzu’s method.
What does the method data tell us?
Validation followed the SANTE guidance. Below are the ranges Shimadzu reports across all 32 analytes:
A closer look at a few numbers
In the dataset Shimadzu published, N-Me-FOSAA (63.07 %) and N-Et-FOSAA (70.50 %) show the lowest recoveries. The document describes “most of the compounds” as falling within 65–135 %, which means some fall outside that window.
The lowest R² belongs to PFBS (0.9673); the remaining 31 analytes are all above 0.98. PFBA was assigned a higher LOQ than the rest of the analytes in this method (0.25 µg/kg versus 0.01 µg/kg).
In other words, most analytes in the list meet the criteria with a wide margin, while a small group sits close to the threshold. In routine use, that group is the one to monitor separately in quality control.
Peak data for six representative analytes
| Analyte | tR (min) | Quantifier transition | Qualifier transition | LOQ (ppb) | R² | Recovery (%) |
|---|---|---|---|---|---|---|
| PFBA | 3.107 | 213.00 > 169.10 | — | 0.25 | 0.9958 | 113.32 |
| PFHxS | 8.172 | 398.90 > 80.00 | 398.90 > 98.95 | 0.01 | 0.9953 | 115.62 |
| PFOA | 8.657 | 412.90 > 368.95 | 412.90 > 219.10 | 0.01 | 0.9951 | 117.10 |
| PFNA | 9.750 | 463.10 > 418.95 | 463.10 > 169.05 | 0.01 | 0.9955 | 91.97 |
| PFOS | 10.384 | 498.90 > 79.95 | 498.90 > 98.90 | 0.01 | 0.9927 | 94.48 |
| N-Me-FOSAA | 12.346 | 570.10 > 418.90 | 570.10 > 511.90 | 0.05 | 0.9836 | 63.07 |
One detail worth attention: for PFBA and PFPeA, the document leaves the qualifier transition column empty. A laboratory adopting the method should clarify the identification criteria for these two analytes against the regulation it works under, since many confirmation guidelines require two transitions.
Calibration equations
The document publishes calibration curves for six analytes at the LOQ level:
| Analyte | Regression equation | R² |
|---|---|---|
| PFPeA | y = 503.0104x + 383.7171 | 0.9927 |
| PFHxS | y = 472.3239x + 433.9777 | 0.9953 |
| PFOA | y = 1422.619x + 8521.691 | 0.9951 |
| PFNA | y = 1714.318x + 12899.62 | 0.9955 |
| PFOS | y = 388.6975x + 2557.059 | 0.9927 |
| 10:2 FTS | y = 319.9747x + 17.18654 | 0.9942 |
The slopes differ by more than a factor of four between PFNA (1714) and 10:2 FTS (320). Signal response varies considerably from analyte to analyte, so each one needs its own calibration curve — exactly how Shimadzu built the calibration in this study.
How should you choose standards when developing a PFAS method?
Ordering the right catalogue number is the last step. Seven questions come before it, in order.
Analyte list
Match every analyte in your method against the component list of the standard mixture. A mixture built for EPA Method 533 does not cover all 32 analytes Shimadzu quantified — the remainder has to come from other standards.
Reference method
The standard is designed for EPA 533 (drinking water). Transferring it to a food matrix places the revalidation responsibility on the laboratory.
Concentration
The same mixture exists at several concentrations and each level is a different Product No. Choosing the wrong level means multiple dilution steps, which increases uncertainty.
Solvent matrix
The standard’s solvent must be compatible with the mobile phase and the reconstitution step, to avoid solvent effects on injection.
Native or isotope-labelled
This study used no internal standards. A laboratory wanting to compensate for matrix effects with isotope-labelled internal standards must order them separately; they are not part of the native mixture.
Certification
A reference standard certified to ISO 17034 comes with a CoA stating certified concentrations, expanded uncertainty, lot number and expiry date. This is the record you must retain.
Storage conditions
Check the storage temperature and the shelf life after opening before planning your usage.
A concrete example from this very study
Mixture DRE-A50000151MW certifies 24 components, while the method quantifies 32 analytes. Eight analytes fall outside the mixture and must be sourced from other standards:
HFPO-DA · DONA · 9Cl-PF3ONS · 11Cl-PF3OUdS · 10:2 FTS · PFUnDS · PFDoS · PFTrDS
This is the easiest thing to overlook. A mixture named after a reference method does not necessarily cover the full analyte list your laboratory needs. Build the component-by-component comparison table before ordering, rather than discovering the gap after the first batch has been run.
Reference documents
Application News 06-SAIP-LC-077-EN
Simultaneous Quantitation of 32 PFAS in Baby Food by LC-MS/MS. The complete 32-analyte results table, chromatograms and calibration plots are in the original document. Download from shimadzu.com — no registration required.
Reference Material Certificate — DRE-A50000151MW
Reference material certificate for lot 2-H538849MW, stating the certified concentration and expanded uncertainty of each of the 24 components. View the certificate (PDF)
This is the certificate of one specific lot. Every lot delivered to a customer carries its own certificate with that lot’s concentrations and expiry date.
Send us your analyte list, the reference method and the sample matrix. QEMIX matches the analyte list against the available Dr. Ehrenstorfer mixtures, identifies what is missing, and supplies the CoA for the exact Lot No. once the batch information is confirmed.
See PFAS Mixture 151 (DRE-A50000151MW) at QEMIX